How to Turn Research Insights Into Test Ideas
By Haley Carpenter
June 8, 2023
Share
Test ideation is a sore spot for many teams. You’d be surprised at how many go off of gut feelings and “we think,” “we feel,” and “we believe” statements.
- We think this image would be better in the homepage hero.
- We feel like this copy will resonate better.
- We believe this is a stronger value proposition.
Usually, team members are not in the target audience. So why would their opinions be applicable? Even if they were, what basis do you have to say one idea is better than another? Do you arm wrestle to choose what to do next?
This approach is far too subjective and always leads to poor results. That approach is not data-backed at all. It’s what practitioners call “spaghetti testing” – flinging stuff at the wall and hoping it sticks. If you find success, you’re usually just getting lucky. We don’t want lucky wins. We want strategic winning that’s predictable, scalable, and repeatable.
So let’s circle back to the term “data-backed.” Strategic winning starts there. The data we need comes from user research. What do I mean by “research?” Let’s dive into it.
Research Methodologies
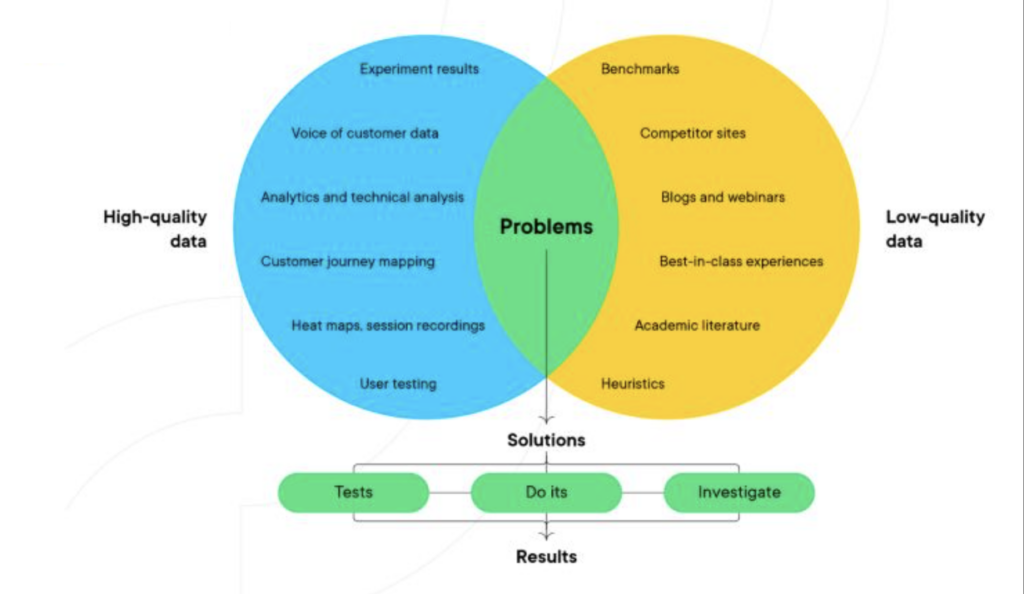
There are several methodologies that collect data including but not limited to analytics, polls, surveys, user testing, message testing, heatmaps, session recordings, card sorting, tree testing, customer journey mapping, personas, and many more. There are also several tools to help us complete each of these. There’s a lot of content and courses available if you don’t know how to do any of them. Don’t be scared or overwhelmed! I always say to start with one or two and work your way to other ones from there. That’s certainly better than nothing. The more you can do though, the better.
Sidebar one: Technically, I don’t count analytics anymore because every company has analytics data these days. If you don’t have that, you have bigger problems to tackle first.

Sidebar two: Additionally, there is a methodology called heuristic evaluation. That’s when someone visually assesses an experience and develops insights based on their experience and expertise. There’s a time and a place for it but it’s not backed by “hard data” most of the time. It’s quite subjective and will be different to some extent depending on who completes it. Your program shouldn’t be based on these types of insights. It’s a great starting point while you’re ramping up other research efforts, or it fills in gaps if your research is lagging at all. Otherwise, don’t rely on this methodology much.
Okay, enough of my sidebars. Let’s get back to the recommended methodologies. When you complete these, you should have a mix of quantitative and qualitative data. Usually, quantitative data tells us the “what” of something, and qualitative data tells us the “why” of something. Also, remember when I said the more methodologies the better? The more ways you can back up an insight, the better and more confident in the insight you will be. That’s relevant because the more confident you are in an insight, the more confident you can be in the test you’re running based on that particular insight. It should play into your test prioritization as well.
Let me give you an example of how this plays out.
Example: Insight → Test Idea
You need some research insights for your homepage. You’ve chosen to use a poll, a heatmap, session recordings, and analytics data. Here’s what insights from each of those could look like:
- Poll: Users don’t understand what is being offered.
- Heatmap: Users aren’t scrolling down the page past the average fold.
- Session recordings: Users are having a hard time finding your services information.
- Analytics: The homepage exit rate is 84%.
Based on those insights, you now know that you’d like to redesign your entire homepage hero section. You’d like to change the following in a variation:
- New H1 and H2
- Add primary and secondary CTA buttons
- New image
- Reduced section height
Imagine you had gone off of your team’s preferences alone instead, and their idea (backed by nothing) was to change the background color instead.
Completely different directions, right? You just saved yourself from wasting time and resources – and possibly losing money from a poor test, too.
Prioritization
Regarding prioritization, let’s say you have another homepage test idea to redesign the section right below the hero backed by only two methodologies: user testing and customer interviews. How does this stack up relative to the homepage hero test we just talked about?
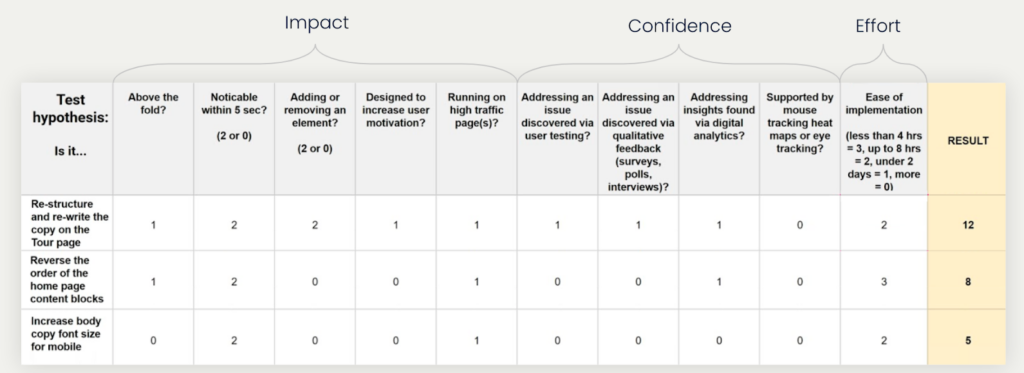
Assuming you have a prioritization framework, it’s ideal to have a part that considers research somehow. I like the PXL, which is similar to an expanded PIE or ICE framework. The default looks like this:

At a high level, know that your test ideas go in the far left column. The scoring parameters go in the top row. You go cell by cell for each test idea and ask each question in the top row relative to your idea on the left. The more times you answer “yes,” the higher the given test idea will score. Each time you answer “yes,” you’ll get a particular number of points in a cell. Points are a good thing here.
Now, look specifically at the “confidence” section. You’ll notice that those parameters are focused on research methodologies. The more methodologies you answer “yes” to, the more confident you can be in the idea. (All of the questions are something to the effect of “are you able to back up your idea with X methodology?”) So in summary, the more data and research, the better. (I know, I know…I’ve harped on this plenty by now. Is it sticking?)
As a TLDR, I want you to know that pretty much every company should have continuous research efforts and some kind of research program (even if you aren’t experimenting!). I want to reiterate that you shouldn’t be intimidated and trying one to get started is a lot more than most companies do. Aim for #strategicwinning!
If you would like to chat more about your experimentation and research efforts, email me at haley@mychirpy.com or connect with me on LinkedIn.
P.S. If you’re interested in learning a repeatable, scalable, easy way to analyze qualitative data (it’s usually perceived as more difficult to work with than qualitative data), check out a recent training I posted here walking through a coding process you can implement right away.
SiteSpect works with partners like Chirpy to help you scale your experimentation program. To learn more about our testing and experimentation platform, schedule some time with an experimentation expert.
Share
Suggested Posts
Subscribe to our blog:


