How to Diagnose, Solve, and Prevent Traffic Problems… With an A/B Testing Solution?
By SiteSpect IT
May 2, 2018
Share
Your RUM based monitoring system just fired off an alert for latency. Your system logs do not reveal anything out of the ordinary, but your site is slowing down. Where do you go from here?
When your site begins to underperform or exhibit an increase in errors, you run the risk of conversions decreasing. Finding the cause and deploying a solution becomes priority number one. Often that’s easier said than done, especially if you have third party solutions interacting with your traffic.
One of the most common calls SiteSpect’s Solution Architecture team receives is to diagnose latency, connection errors, and page errors. Unlike other A/B testing solutions, the SiteSpect platform can help you diagnose and solve these problems, speeding up your diagnostic process, reducing errors, and shortening and downtime.
Diagnosing Traffic Problems
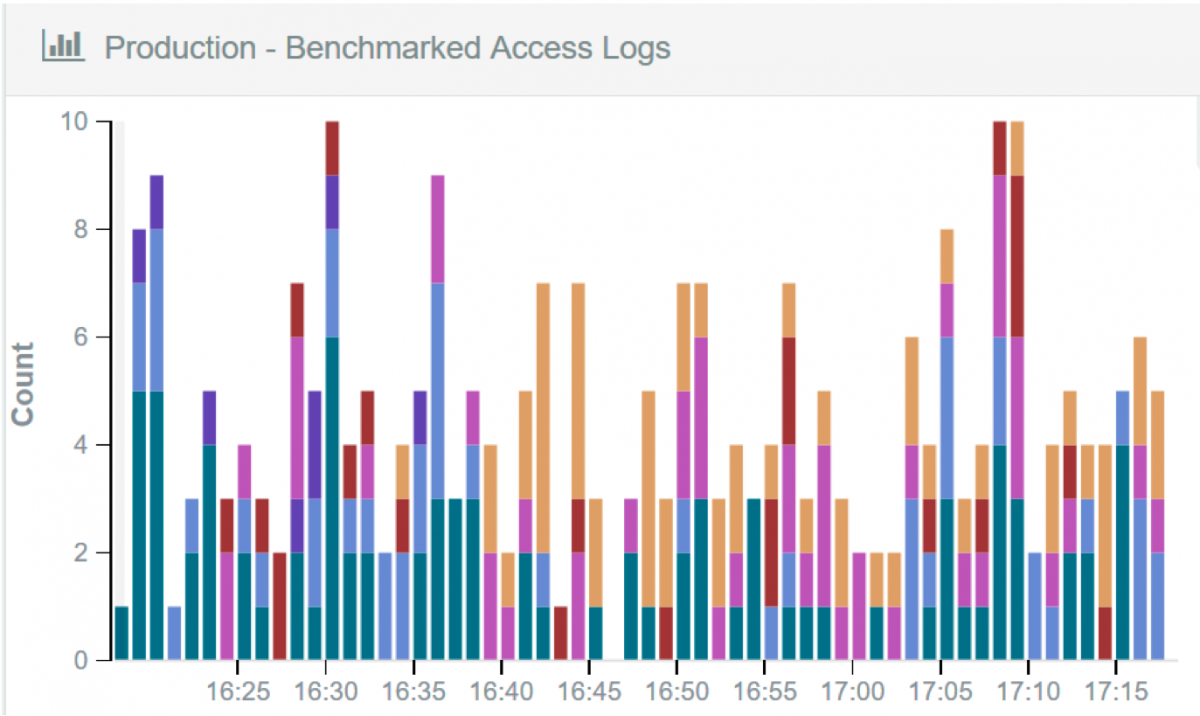
SiteSpect’s Log Visualization tool offers deep visibility into the SiteSpect -> Origin leg of traffic. It is a powerful tool that you can use to identify application caused latency and errors. SiteSpect’s platform also lets you quickly implement fixes for any client side issue that you encounter.
If the internet were a single wire connecting your visitors to your site, you would have complete visibility into your site’s behavior; You would know exactly how your web infrastructure responded to requests (perimeter monitoring) and you would know exactly what your site visitor experienced (RUM monitoring).
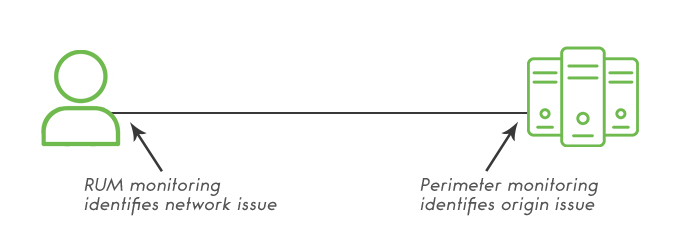
Any error reported by RUM but not Perimeter Monitoring suggests that the issue is either on the line or client side.
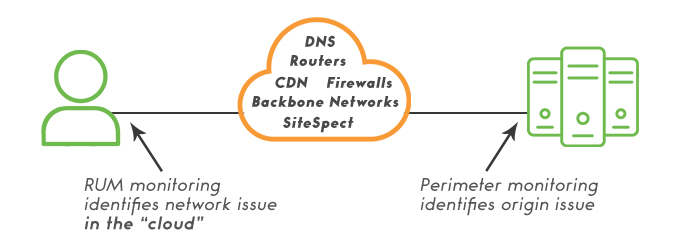
Too bad the internet is not that simple. There are switches, routers, firewalls, CDNs, proxies, backbone networks, security devices, fluidic dark matter (OK, I made that last one up) and more that your traffic needs to route through. In reality, the process of getting your site delivered means you have very little visibility or control over how things route or function.
Keep an Eye on the Whole Picture
So, what does all this mean for your monitoring program? Well, when your RUM monitoring triggers an alert, all you see is that there was an issue from the visitor’s browser into the networking cloud. The points where the cloud is opaque to your RUM monitoring limits your visibility and make it a challenge to debug the problem.
With SiteSpect’s Log Visualization tool, you can graph your web server’s response times, SiteSpect response times, error codes, and any networking issues that happen on that back leg.
Want to know how long your web servers took to respond to a request? We can do that!
Want to know if you have applications taking seconds, or even minutes to respond? We can do that!
Want to see traffic distribution within the SiteSpect networks? We can do that!
No one wants traffic interruptions. With increased visibility through SiteSpect’s Log Visualization, you’ll be able to diagnose issues faster and with more accuracy. Then, using the SiteSpect platform, you can roll out a hot fix within minutes, thus limiting any potential decrease in conversion rates.
“Tal Talks” is an article series for IT professionals from SiteSpect’s resident IT guru, Tal Cohen. For over 12 years Tal has been assisting SiteSpect customers with digital infrastructure issues and challenges in improving customer experience.
Download the SiteSpect Cloud – Technical and Operations Guide
Read More From Tal Talks Learn About SiteSpect Architecture
To learn more about SiteSpect, visit our website.
Share

Suggested Posts


Subscribe to our blog: